by William (Bill) Harrell, Jr, DMD
 Why we need 3-D imaging for our routine orthodontic patients
In orthodontics, we routinely evaluate our patients by using a “patchwork quilt” set of 2-D diagnostic information: cephs, photos, and panoramic x-rays. None of these 2-D images are calibrated or cross-correlated to each other, and each has its own projection geometry problems. The only true 3-D information we routinely use today comes from our evaluation of the live patient sitting in the chair, plaster study models of the teeth, or 3-D digital computerized study models created from various scanning techniques of either the study models or impressions.
Limitations of 2-D Cephalometric Analysis
There are numerous problems and limitations when evaluating a 3-D object with only 2-D images. Moyers1 and Baumrind2 have listed the limitations of 2-D cephalometrics and some of the sources of errors. Some of these are listed below:
1) improper positioning of the patient;
2) inadequate radiation exposure resulting in poor image quality;
3) inconsistent or unrecorded mid-sagittal-plane-film distance; and
4) landmark identification errors and tracing errors due to lack of technical skill or inadequate knowledge of the anatomy.
Moyers1 has said, “When a three-dimensional, highly irregular object, such as the face, is radiographed, there always will be enlargement and distortion. The cephalometric technique attempts to minimize and standardize these factors, even though they are always present….When one presumes to reduce a three-dimensional biologic entity as complicated as the human face to a two-dimensional geometric figure as simple as a triangle, and then attempts to interpret accurately all of the changes taking place during growth and treatment, the possibilities for misuse of the method are made apparent.”
Donald Enlow, PhD, in an editorial in 2000,3 wrote, “Traditional cephalometrics was developed before there was a working understanding of the biological processes of facial growth. Now with the imminent advent of 1) very advanced computer 3-dimensional imaging, and effective visualization, and 2) with our markedly advancing and really meaningful understanding of the biology of craniofacial development, the marriage of 1) and 2) is going to turn craniofacial diagnosis inside-out within the foreseeable future. … The near future will be based on the actual biology of an individual’s own craniofacial growth and development, and it will be determined by a 3-dimensional evaluation based on that person’s actual morphogenic characteristics, not simply developmentally irrelevant radiographic landmarks.”
Barry Grayson, DDS, and his colleagues, in a landmark article, “The Three-Dimensional Cephalogram: Theory, Technique, and Clinical Application,”4 presented how a 3-D cephalogram might be presented and used. They also explained some of the limitations of 2-D cephalometrics and how 2-D evaluation of growth can be much different from analysis in 3-D.
 A study recently completed at the University of California at San Francisco5 compared the number of errors using physical measurements made on human dry skulls, traditional 2-D cephalometrics, and a calibrated system of the same 2-D cephalometric x-rays used to create 3-D landmark locations from photogrammetry algorithms. The purpose of this project was to evaluate and compare a 3-D imaging system and the traditional 2-D cephalometry with regard to accuracy in recording the anatomical truth as defined by physical measurements with a calibrated caliper.
Thirteen skeletal landmarks were located by both radiographic methods on nine dried human skulls. Intra-class correlation (0.995), variance (0.054 mm2), and standard deviation (SD, 0.237 mm), were averaged over 76 measures, and derived from precision calipers to establish these physical measurements as a reliable gold standard to make comparisons between the 2-D and 3-D radiographic methods.
The results of the study revealed a high amount of variability of the SD from the gold standard inherent in the conventional 2-D method, with the range varying from underestimating measurements by 17.68 mm (Gn–Zyg R) to overestimating by 15.52 mm (Zyg L–Zyg R), with a mean SD of 6.94 mm.
By contrast, the 3-D method showed variations from the SD that ranged from underestimating by 3.99 mm to overestimating by 2.96 mm, with a mean SD of 0.54 mm. The 3-D evaluation was much more precise, approximately within 1 mm of the gold standard. These results indicate that when the actual distance is measured on a human skull in its true dimensions, the 3-D method is more precise and four to five times more accurate than the 2-D approach. Evaluating distances in 3-D space with a 2-D image grossly exaggerates the true measure and offers a distorted view of craniofacial growth. There is an inherent problem of representing a linear measure occupying a 3-D space by a 2-D image.
The true measurements are not represented because of geometric errors of projection,6 linear projective transformation errors,7 foreshortening, elongation, and head- positioning errors. Even if we view the patient’s anatomy from various standard 2-D views, such as a lateral ceph, frontal ceph, and/or submental vertex view (SMV), we still do not have a true understanding of the 3-D anatomy, and each 2-D projection has its own linear projective transformation errors and landmark identification errors.
What Types of 3-D Technology Are Available?
Cone beam CT (CBCT),9,10 also known as cone beam volumetric tomography (CBVT) or tomosynthesis, produces accurate 3-D image data of the craniofacial region. The first CBCT scanner was introduced in the United States in May 2001.
Cone beam CT is a new form of computed tomography that uses different source detectors and a different type of acquisition than traditional fan-beam medical CT. Fan-beam CT images the patient as a series of axial cuts—like a fan—that are captured as individual slices, which can be stacked into a 3-D volume or viewed in cross-sections. The voxel size is dependent on the scan thickness, which is usually between 1 and 5 mm. The radiation dosage used in conventional fan-beam CT is much higher than what is required for cone beam tomography.9
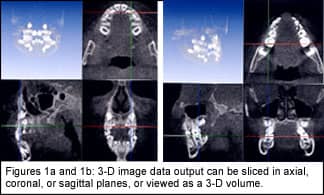
CBVT uses one rotational sweep of 360º, and is a cone-shaped beam. The scan times vary from 10 to 75 seconds, depending on the unit. The radiation dose for a complete volume of the maxillofacial area is similar to that needed for a dental periapical survey.9 An orthodontist can get much more information from one cone beam scan than from the multiple 2-D images that we traditionally take—and with a much lower dose of radiation. The voxel size of CBVT is between 0.1 and 0.3 mm in the X, Y, and Z planes. The image data output can be sliced in various planes (axial, coronal, or sagittal) or viewed as a 3-D volume (Figures 1a and 1b). Accurate measurements can be made on any part of the anatomy so that the patient’s anatomic truth can be accurately analyzed.
     |
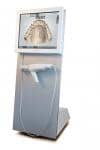
In February 2004, a new cone beam scanner with a 12-bit system was introduced. It is about the same size as a traditional panoramic x-ray unit. Patients are placed in an upright, seated position. The radiation dose for a full-head volume is about the same as that of a dental periapical survey.
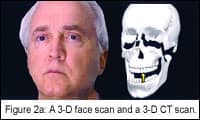
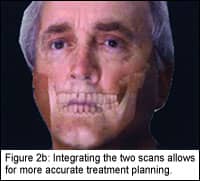
The examples in Figures 2a and 2b (page 40) show how 3-D face scans and 3-D CT scans may be integrated into a 3-D patient’s anatomy, which will allow for more accurate diagnosis and treatment planning, outcomes analysis, and monitoring of treatment changes over time.6,8,9
How Might We Use 3-D Technology In Our Practices?
Technologies are being developed that will allow 3-D imaging to be done on our patients to provide an accurate representation of the anatomy. The following are some of the applications that we will be using in the near future:
1) Orthodontic treatment planning: Using 3-D will allow you to automatically measure the Bolton tooth size and arch length, accurately, and then evaluate different treatment options, such as extractions, expansion, and interproximal stripping. You will also be able to see what effect different treatments might have on the face, so that you can choose among possible orthodontic treatment plans such as, minimum anchorage (closing space from the posterior forward), moderate anchorage (closing space equally from the posterior and the anterior), and maximum anchorage (closing space to the posterior).
In nonextraction cases, if the treatment plan calls for expansion or uprighting of the dental or skeletal arches, then the gains in arch length can be measured by the computer, and the orthodontist can decide if this treatment fits into the treatment scheme.
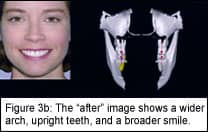
Figure 3a is a “before” image of a case where the patient has a narrow smile caused by a narrow posterior with “dark spaces” and lingually tipped posterior segments. In the “after” image (Figure 3b), the patient has a wider arch form, upright teeth, and a broader smile.
Using 3-D imaging can also help determine how much interproximal stripping per tooth is required. For example, you can set the computer so that teeth collide as they do in real life, or you can use a noncollision setting that will show the teeth with equal overlap of the contacts from the mesial of the maxillary right and left second bicuspids. You have a total of nine contact areas between those two teeth. With an arch length discrepancy (ALD) of 8.3 mm per nine contacts, you have a 0.92 mm per two-tooth contact, which equals 0.46 mm per tooth.
2) Monitoring treatment over time: As Ron Roth famously said, “Begin with the end in mind.” The ability to determine the end-of-treatment goal is attainable with 3-D imaging. It is important to move the teeth in relation to the needs of the face and soft tissues, so that you can treat the whole patient and not just the teeth.
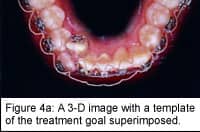
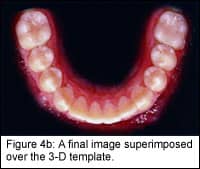 Accurate treatment monitoring over time is a big advantage of 3-D modeling. Examples of this are shown in Figures 4a and 4b (page 42). These images are important because they show parents and patients accurate progress; and if the patient is not cooperating, you can document the problem and solve it! Asymmetries are always present and can affect the end result. These are best documented before treatment begins.
3) Orthognathic surgery cases: Seeing changes that you make in the lateral and then being able to see what occurs in the frontal, 45º, or any view is an important advantage of 3-D imaging. Our patients see themselves from the frontal up to a 45º view.
4) Impacted cuspids: An orthodontist can use a 3-D reconstructed digital model, from cone beam data, of an impacted canine to evaluate the vector of force and positioning of the bracket needed to move the canine into proper position without impinging on the surrounding teeth (such as the maxillary central and lateral roots).
True 3-D analysis and treatment planning can be made on digital computer models of patient anatomy, which may include teeth, skeletal structure, and facial soft tissue, along with photo-textures. This type of 3-D output to the orthodontist can be viewed from any angle, sliced, or made transparent to reveal underlying anatomy, individual teeth, and sections of bones. It can be manipulated by the orthodontist for both orthodontic and orthognathic surgery treatment planning purposes. Orthodontics is beginning a path toward more accurate treatment planning and analysis. This will lead the way for the evidence-based practices of the future. z
William (Bill) Harrell, Jr, DMD, is a board-certified orthodontist in private practice in Alexander City, Ala. He is the AAO representative to the Standards Committee on Dental Informatics (SCDI) of the ADA, and the SAO representative to the Council on Information Technology (COIT) of the AAO. He can be contacted at [email protected].
References
1. Moyers, RE. Handbook of orthodontics, 3rd edition. Chicago: Yearbook Medical Publishers; 1975;423-425.
2. Baumrind S, Frantz RC. The reliability of head film measurements. 1. Landmark identification. Am J Orthod. 1971;60(2):111-127.
3. Enlow, DH. Editorial in Am J Orthod Dentofacial Orthop. 2000;117(2):147-148.
4. Grayson B, Cutting C, Bookstein FL, Kim H, McCarthy JG. The three-dimensional cephalogram: theory, technique, and clinical application. Am J Orthod Dentofacial Orthop. 1988;94:327-337.
5. Adams GL, Gansky S, Miller AJ, Harrell W, Hatcher DC. Comparison between traditional two-dimensional cephalometry and a three-dimensional approach on human dry skulls. Am J Orthod Dentofacial Orthop. 2004;126(4):397-409.
6. Harrell, W, Hatcher, D, Bolt, R. In search of anatomic truth: 3-D digital patient modeling and the future of orthodontics. Am J Orthod Dentofacial Orthop. 2002;122(3):125-130.
7. Tsao DH, Kazanoglu A, McCasland JP. Measurability of radiographic images. Am J Orthod. 1983;84(3):212-216.
8. Harrell, WE. Future of imaging in orthodontics. In: Riolo M, Avery J, eds. Essentials for Orthodontic Practice. Ann Arbor, Mich: EFOP Press; 2003:405-413.
9. Hatcher, DC, Harrell, WE. Diagnosis goes digital. In: McNamara JA, ed. Information Technology and Orthodontic Treatment. Ann Arbor: University of Michigan, 2003;79-91.
10. Mozzo P, Procacci C, Tacconi A, Tinazzi Martini P, Bergamo Adnreis, IA. A new volumetric CT machine for dental imaging based on the cone-beam technique: preliminary results. Eur Radiol. 1998;8:1558-1564.